
From Data Point to Ticket in Seconds: Marking Anomalies Directly in the Operational Data Charts
Published on 01.09.2026
WAKU Care
WE EMPOWER UPTIME HEROES
Your Software Platform that keeps machines running.
A technician is watching the Operational Data Charts for a conveyor line. The vibration readings on one axis have sat slightly above the usual line for three days. No alarm. Nothing that would trip a threshold. But a pattern he has seen before, shortly before a bearing failed.
He wants to capture it. So he takes a screenshot. Switches to a second window, the CMMS. Opens a new case. Types out the time range he saw in the chart, as precisely as he can remember it. Describes in words what is really a picture. Uploads the screenshot. Sends the case to a colleague who knows the machine better.
Ten minutes have passed. The actual data point is already a little diluted in the description. The colleague who opens the case later sees an image and a paragraph of text, but not the raw data behind it. She has to switch back into the charts herself just to understand what is being referenced.
The problem is not spotting the anomaly. The problem is the path from noticing it to acting on it.
The Expensive Gap Between Seeing and Acting
Maintenance has a name for this window: the P-F interval, the span between the first detectable sign of a developing fault and the actual functional failure. According to analysis from Advanced Technology Services, this window varies widely: bearing wear can give weeks of warning, while electrical faults may give only seconds. The longer it takes to turn a detected signal into a concrete action, the smaller the window left for a planned repair instead of a reactive one.
That translation process costs more time than most teams realize. According to research from Advanced Technology Services, only 30 to 40 percent of total repair time is spent on the actual repair. 60 to 70 percent is organizational delay: detection, hand-off, diagnosis, verification. Exactly the phase where an observation has to be translated first into words, then into a ticket, then into a task someone else can understand. At the same time, the same analysis shows that facilities with faster, IoT-enabled fault detection cut their repair time by 40 to 60 percent, simply by shortening that translation phase.
It is no surprise, then, that studies show technicians spend only 25 to 35 percent of their shift on actual hands-on repair work. The rest goes to searching, documenting, and waiting. Incomplete or imprecise reports make it worse: according to research on maintenance time management, a technician loses an average of 45 minutes per shift on clarification and rework caused by incompletely documented work orders alone.
There is a second, quieter problem on top of this. Anyone who has to manually describe and forward every anomaly eventually starts ignoring the smaller ones, because the effort of documenting exceeds the perceived benefit. Alert fatigue describes exactly this phenomenon: relevant signals get lost in the noise because reporting itself becomes a burden.
Marking Instead of Describing
This is exactly where the Operational Data Charts in WAKU Care come in. Instead of putting an observation into words, the technician marks the anomalous region directly in the chart. One click, one drag across the relevant time range, done.
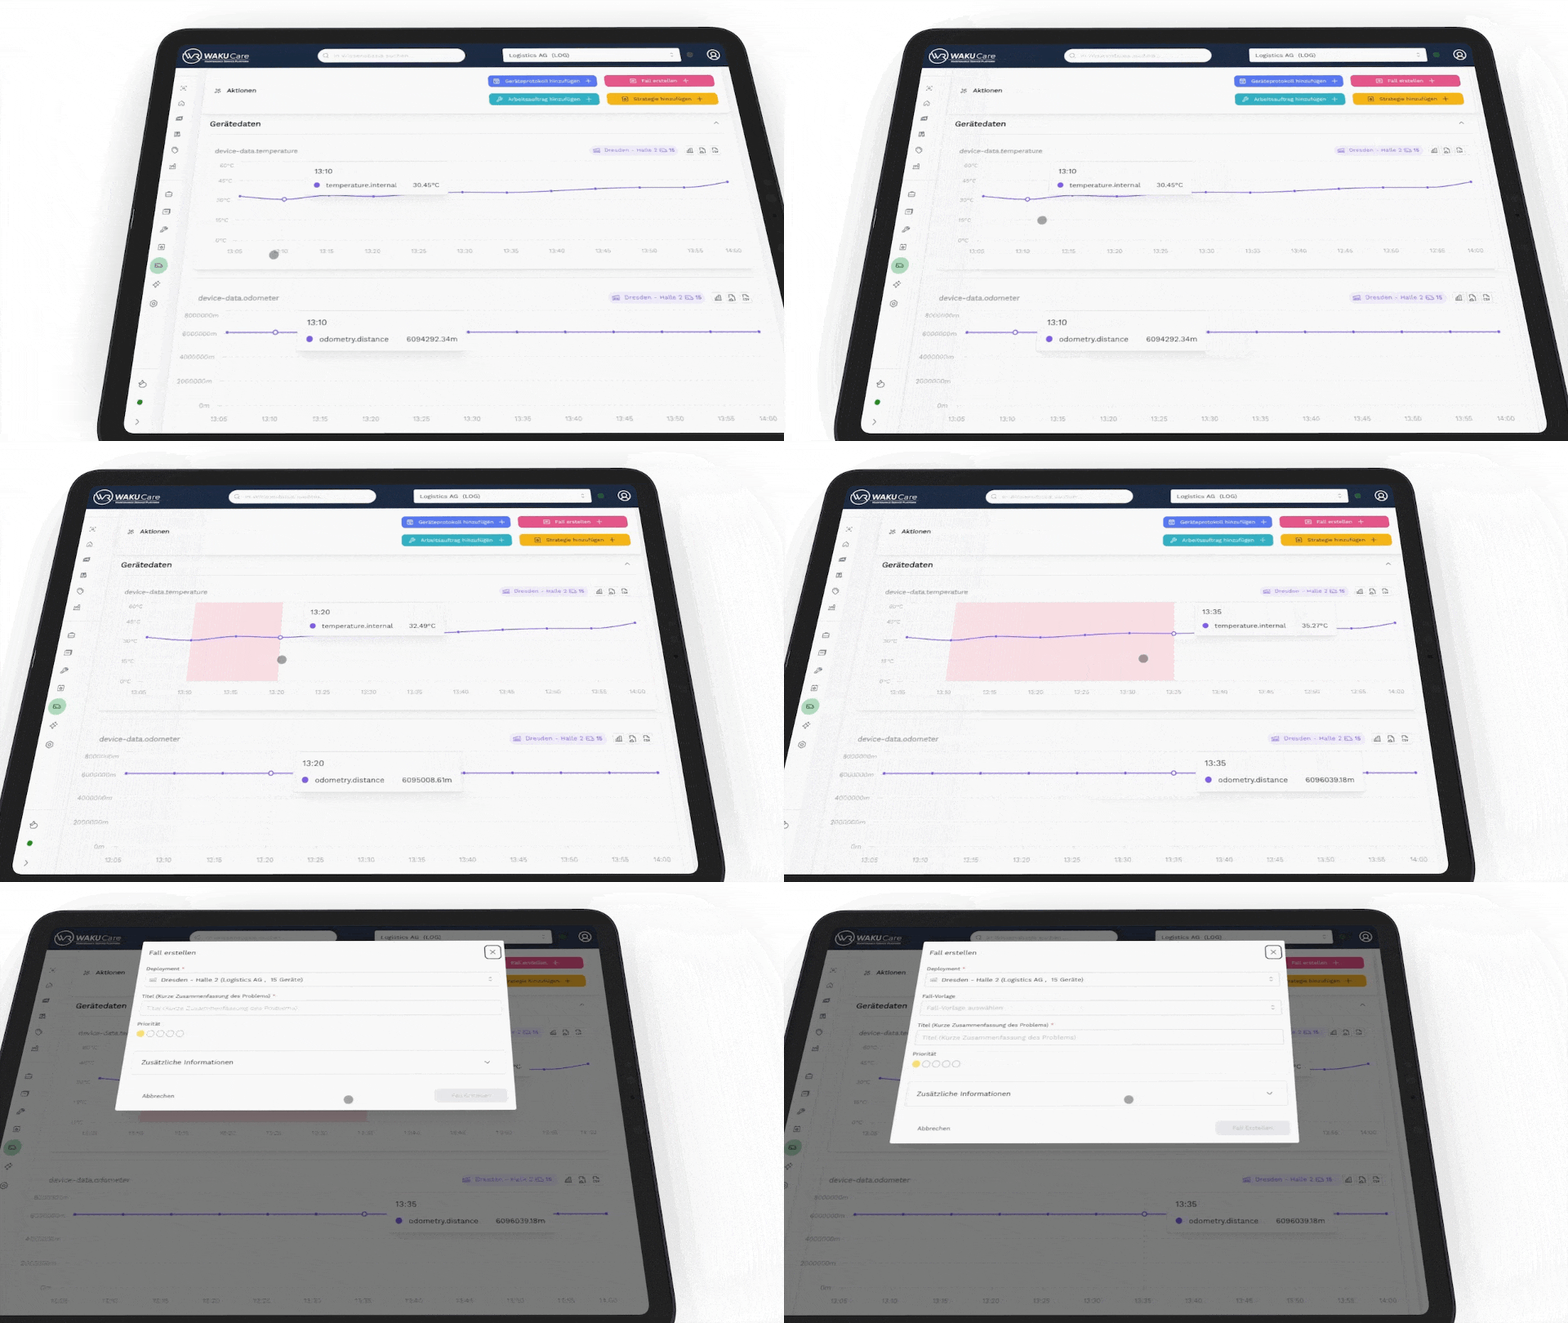
That selection automatically creates a case, and not an empty one. The marked data range, the exact time window, the affected sensor, and the asset are already fully attached. No intermediate step. No translation. No guessing which time range was actually meant.
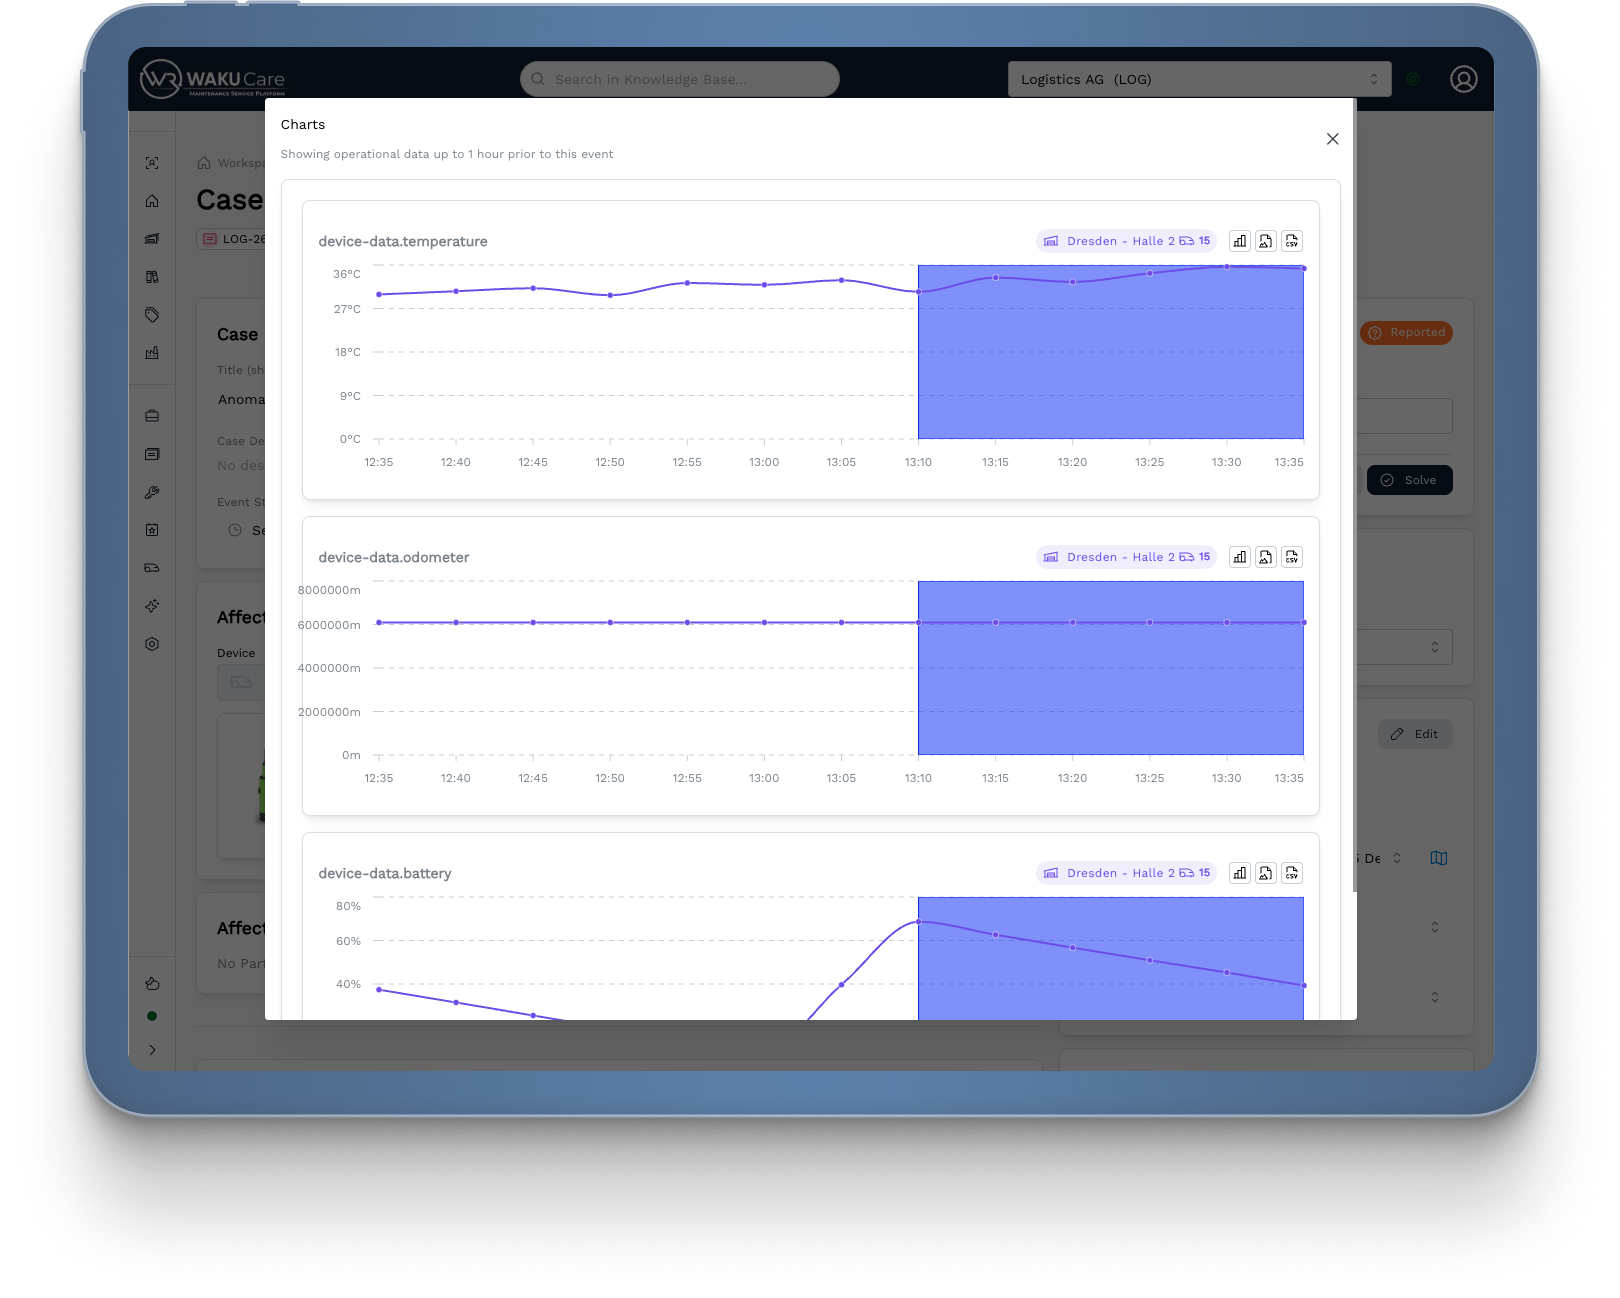
The result is a Full Context Case: a case that knows what it is about from the very first moment. The colleague who opens it does not just see a paragraph and a picture. She sees the actual raw data of the marked range, embedded directly in the case, linked to the asset and its history from the Asset Record File.
IMA Has Already Seen the Context
This is where IMA, the smart assistant in WAKU Care, comes in. It is not a separate tool that first needs to be fed information. It has immediate access to the same case context: the marked data range, the asset's timeline from the Asset Record File, similar past cases, and relevant entries from the Knowledge Hub.
Instead of a technician first having to research whether this pattern has appeared before, IMA delivers a first solution suggestion directly, based on exactly the data tied to this case. Not a generic chatbot offering general maintenance tips, but an assistant that knows which asset, which sensor, and which history actually matter right now.
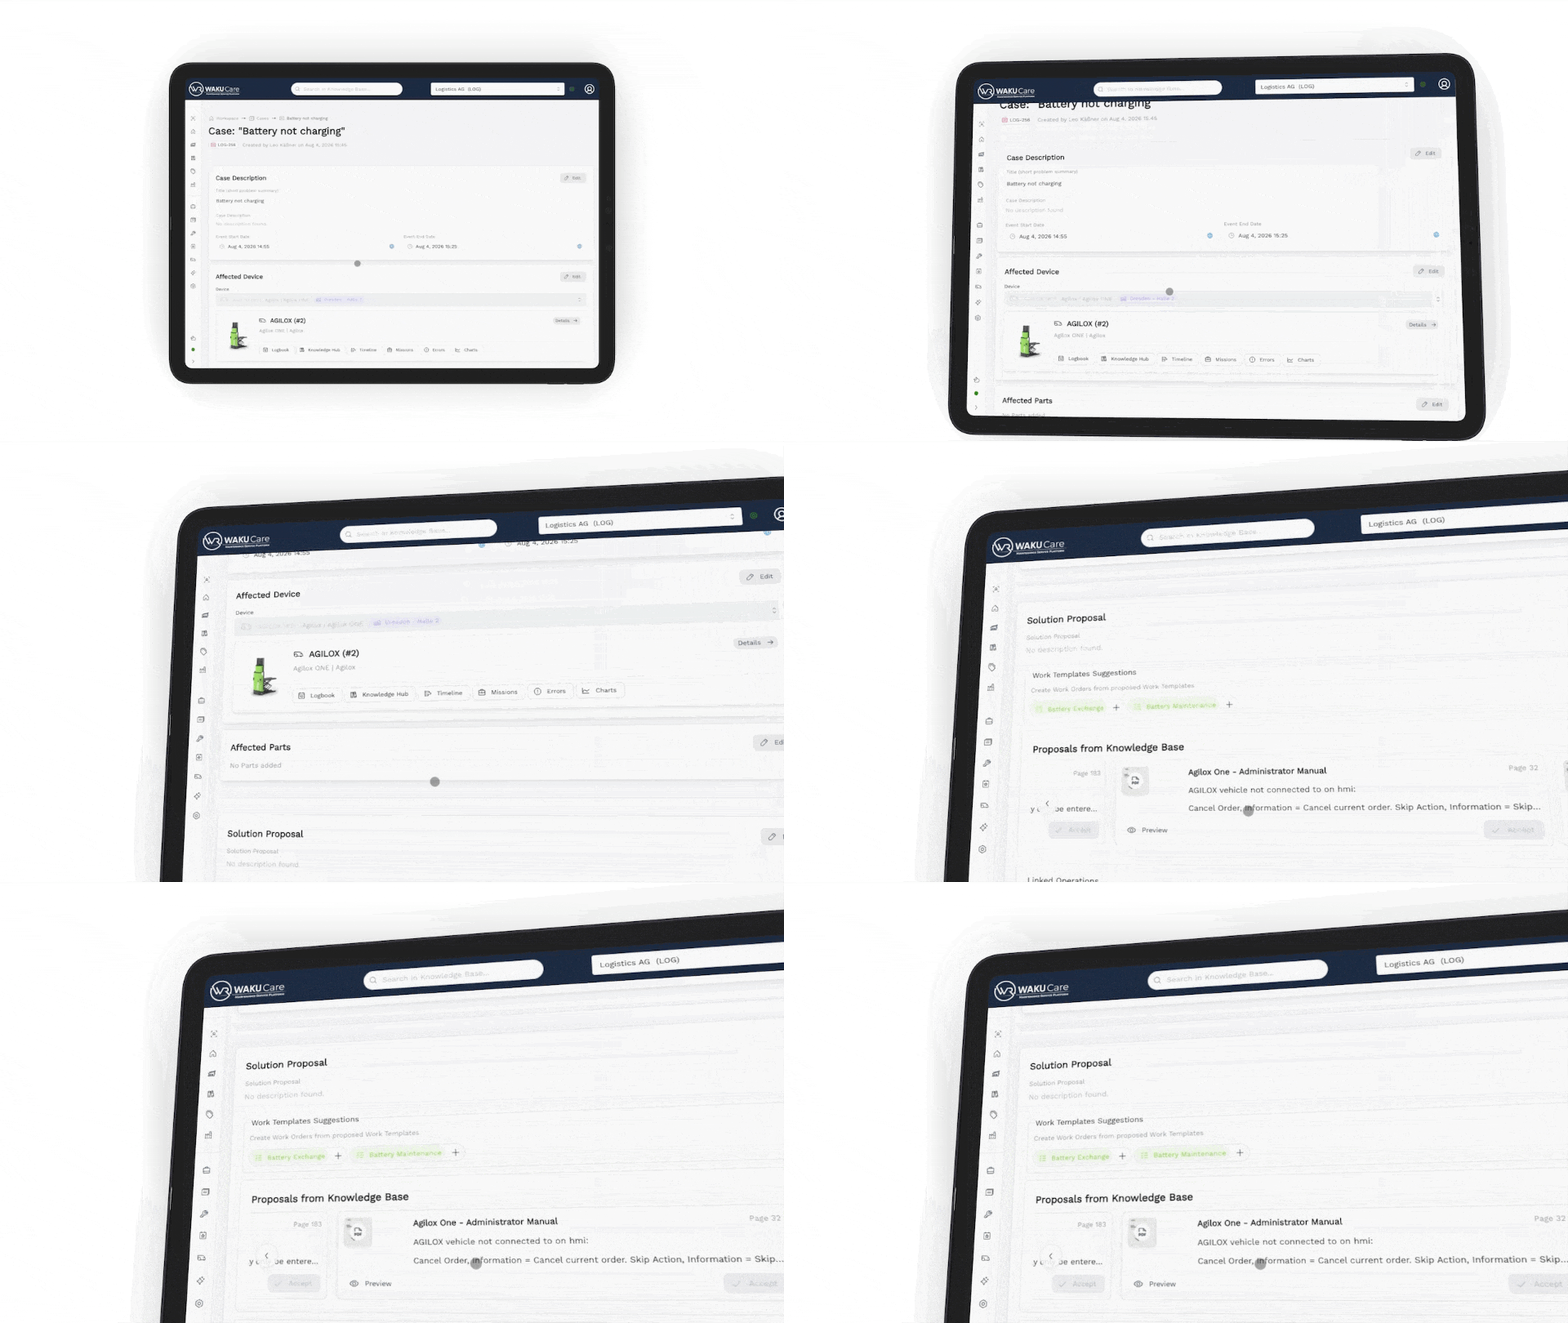
For the colleague picking up the case, this means she does not start from zero. She starts with a complete picture and a concrete first lead.
What This Changes in Practice
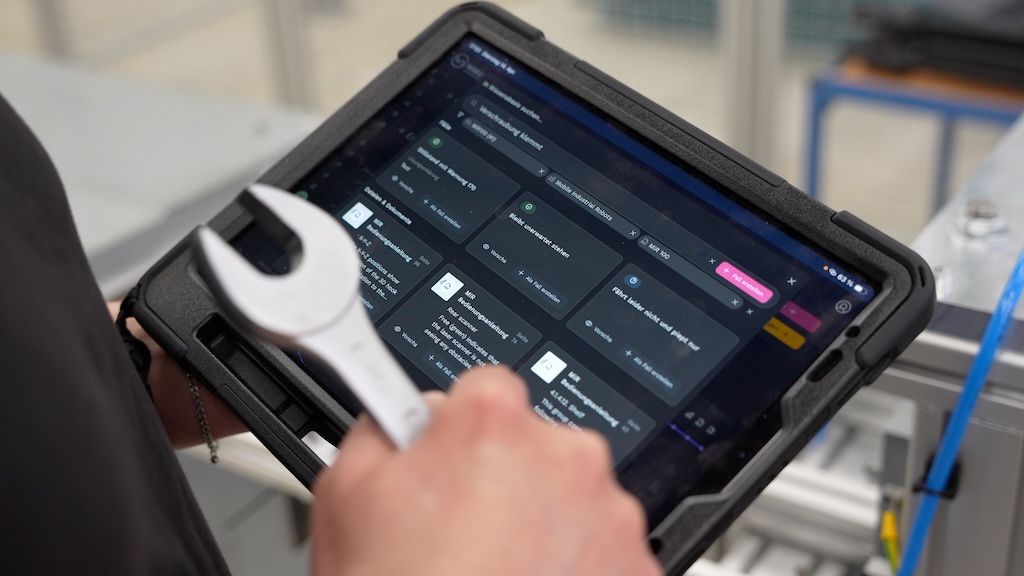
For technicians, this means less time in front of a second screen and more time at the machine. Capturing an observation takes seconds instead of minutes. Exactly the effort that, according to the numbers above, otherwise drives alert fatigue disappears. Smaller anomalies get reported more often, because reporting is no longer a hurdle.
For decision makers, this means more early signals captured, not fewer. Every marked selection is a documented, traceable data point, not a verbal hand-off that eventually gets lost. Over time, this builds a reliable basis for understanding which patterns actually precede a failure, and which do not. That foundation is what any further automation of fault detection has to build on.
From Signal to Solution, Without the Detour
The Operational Data Charts turn an observation that would otherwise get lost between memory, screenshot, and text field into a structured, immediately usable case. Full Context Cases mean nobody has to reassemble the context from scratch. IMA means the first assessment never starts from zero.
A human still has to spot and mark the anomaly. In the next article of this series, we show what happens when that step itself gets automated: when Device Data Triggers detect anomalies on their own and launch the entire case without any manual intervention. That is the moment the loop closes into Closed-Loop Maintenance.
Want to see for yourself how fast a data point becomes a fully contextualized case? Request a demo directly.
All Articles in the Series
Previous Articles
Article 01 — The hidden costs of reactive maintenance
Article 02 — Recognizing Patterns Before Something Breaks — the Timeline View in the Asset Record File
Next Articles
Article 04 — Closed-Loop Maintenance — From Sensor Signal to Solution Proposal Without Manual Intervention (link coming soon)
Article 05 — AI That Thinks Like an Experienced Technician — IMA as a Smart Assistant in the Closed Loop (link coming soon)
Article 06 — Predictive Maintenance in 30 Days — How Teams Get Started with WAKU Care Without a Major IT Project (link coming soon)
WAKU Robotics supports you in choosing the right robot for your application. We take care of the procurement of the robots as well as the on-site test. Our WAKU Care software helps you to operate the robots across manufacturers and to analyze the processes.
Contact WAKU